]po[ Reporting Dashboard
(Please click on the hexagons for more information)
This package presents graphics based on real time data collated from various sources for defined areas of concern. The visually-based approach allows quick analysis to key business information, which is vital for executive action and management. Upper management and project managers get a real-time and comprehensive overview about the company’s key data and performance indicators without having to look through numerous lists of data. The dashboard allows for better decision-making and results in enormous time-savings.
- [Generic]
- Project Histogram
- [Indicators]
- [Project Portfolio]
- [Yearly Revenue]
- [All Time Top Customers]
Sample implementation of Dashboard realized with Google Charts
Provided by Venkat Mangudi
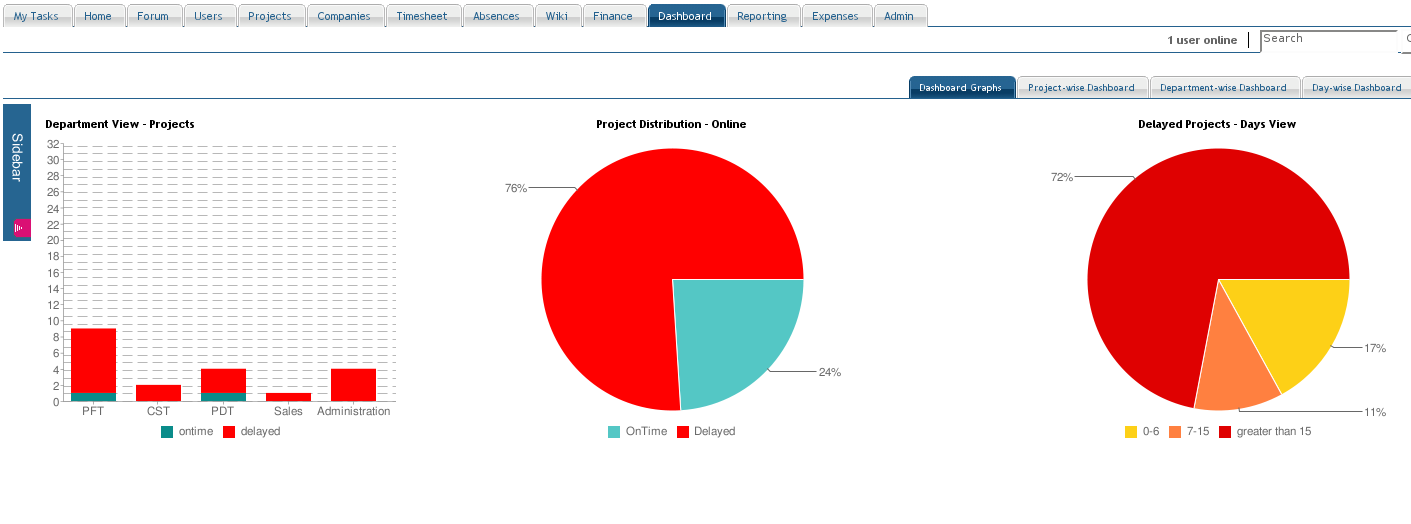
(Summary)
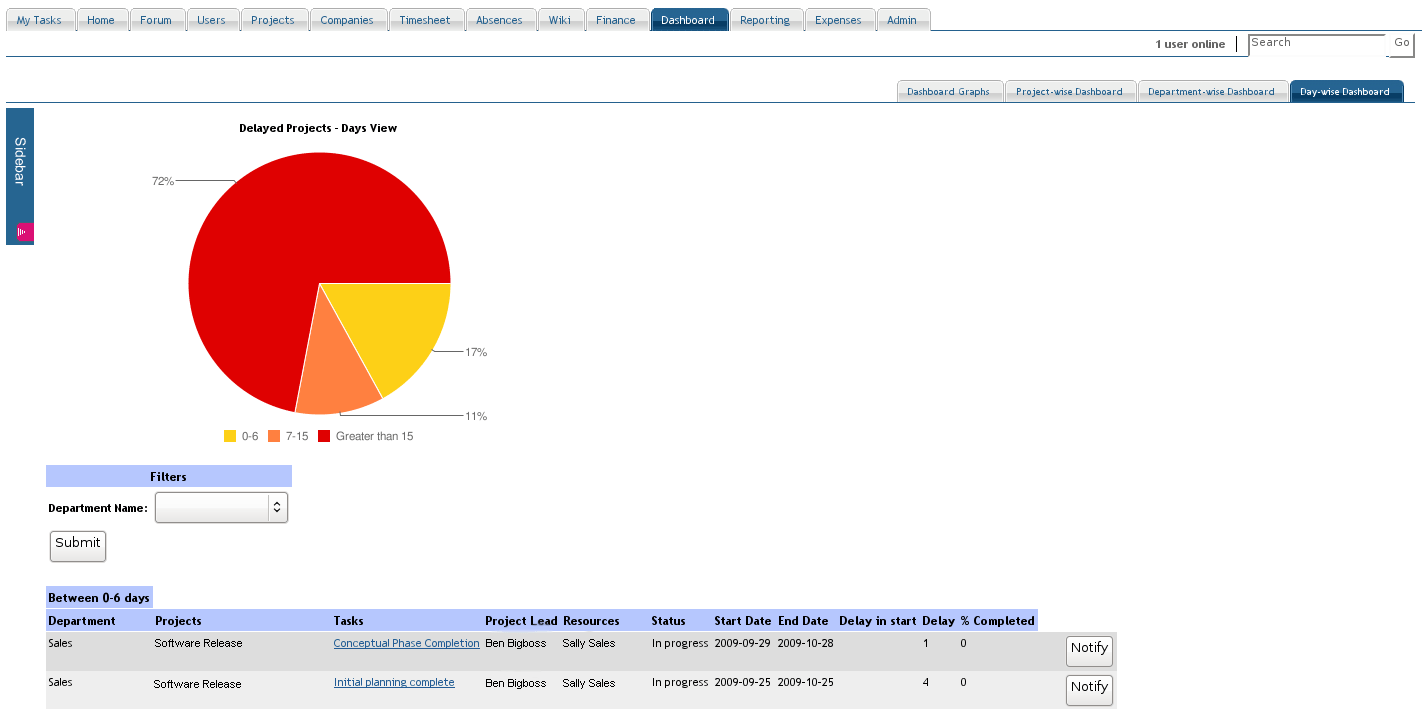
(Day-wise)
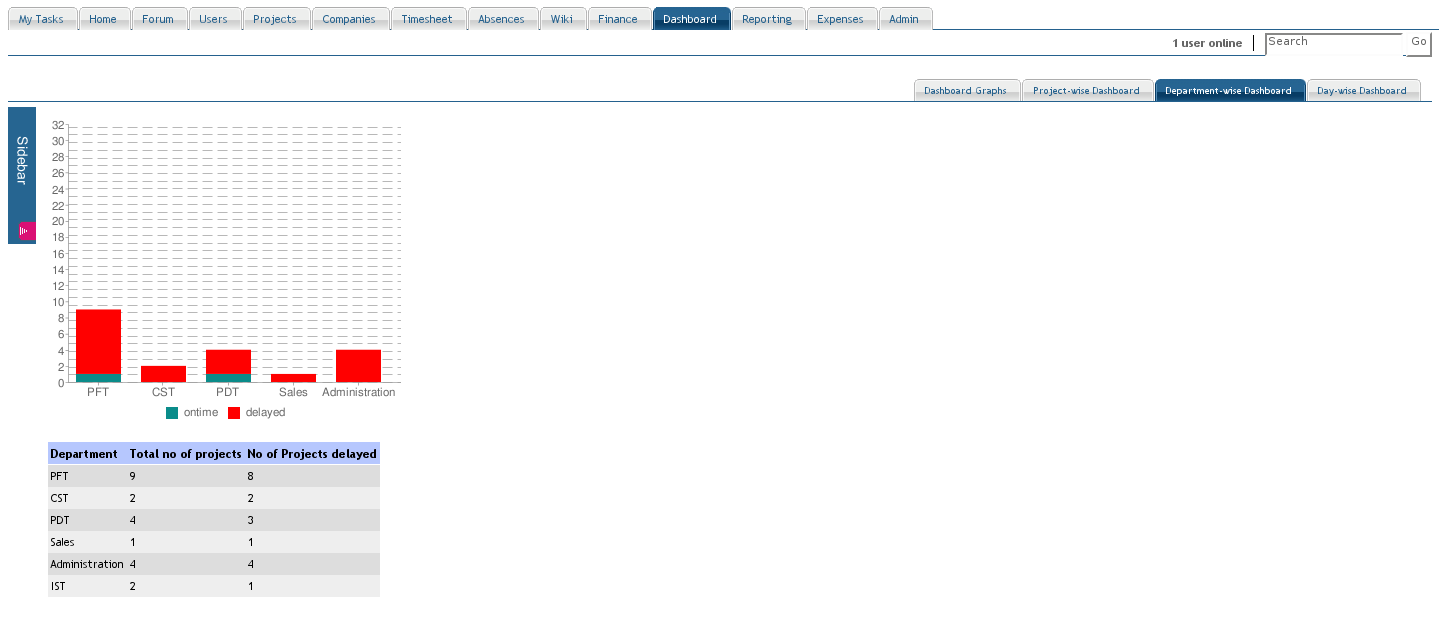
(Dept-wise)
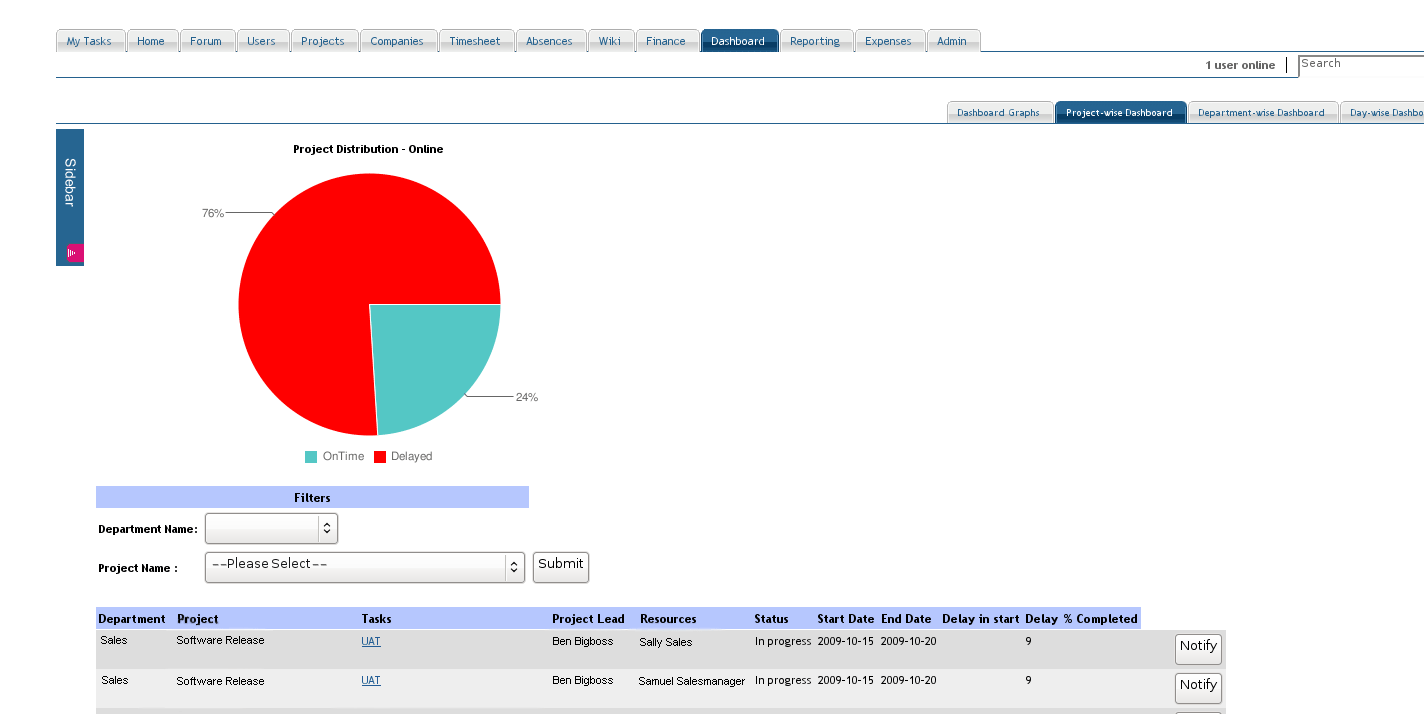
(Project-wise)
Package Documentation
Procedure Files
Procedures
im_dashboard_active_projects_status_histogram Returns a dashboard component for the home page im_dashboard_all_time_top_customers_component Returns a dashboard component for the home page im_dashboard_color Returns suitable colors, depending on the respective skin im_dashboard_color_default Returns suitable colors, depending on the respective skin start_color { return "0080FF" } end_color { return "FF8000" } bar_color { return "0080FF" } im_dashboard_color_saltnpepper Returns suitable colors im_dashboard_generic_component Returns a dashboard component for the home page im_dashboard_histogram Returns a formatted HTML text to display a histogram chart based on Lutz Tautenhahn' "JS Diagram Builder", v3.3. im_dashboard_histogram_sql If ExtJS is available returns an ExtJS BarChart, otherwise uses the Tautenhahn lib im_dashboard_histogram_sql_sencha Returns a dashboard component using Sencha ExtJS Requires a SQL statement like "select im_category_from_id(project_type_id), count(*) from im_projects group by project_type_id" im_dashboard_histogram_sql_tautenhahn Returns a dashboard component using the Tautenhan JS library. im_dashboard_pie_chart Returns a formatted HTML text to display a piechart based on Lutz Tautenhahn' "JS Diagram Builder", v3.3. im_dashboard_pie_colors Returns an array with color codes from 0.. im_dashboard_project_eva Returns a HTML component with a timeline of a project with financial information associated. im_dashboard_project_phases_volume Returns a HTML component with a diagram of project volumes per phase im_dashboard_revenue_by_dept Returns a HTML component with a timeline of a revenues by department. im_dashboard_revenue_by_year_monthly Returns a HTML component with a timeline of a revenues by month im_dashboard_status_matrix Returns a matrix that shows how many objects have changed their status in the given time period. im_dashboard_status_matrix_helper Evaluates an SQL that returns cnt, old_status_id and new_status_id and returns the values as list suitable for a hash array with key = $old_status_id-$new_status_id im_dashboard_top_customers Returns a HTML component with a pie chart with top customer im_reporting_dashboard_sweeper Deletes old dashboard DW entries v Acts like a "$" to evaluate a variable, but returns "-" if the variable is not defined instead of an error.
SQL Files
sql/postgresql/intranet-reporting-dashboard-create.sql sql/postgresql/intranet-reporting-dashboard-drop.sql
Content Pages
| www/ | |
| all_time_top_customers.adp | |
| all_time_top_customers.tcl | |
| area-diagram-test.adp | |
| generic.adp | |
| generic.tcl | |
| histogram.adp | |
| histogram.tcl | |
| index.adp | |
| index.tcl | Dashboard main page |
| indicators.adp | |
| indicators.tcl | Demo page to show indicators |
| project-eva.json.tcl | Datasource for top-customers Sencha pie chart. |
| project-phases-volume.json.tcl | Datasource for top-customers Sencha pie chart. |
| project-portfolio.tcl | |
| revenue-by-dept-details.tcl | Lists risks per project, taking into account DynFields. |
| revenue-by-dept.json.tcl | Datasource for revenues-by-dept Sencha line chart. |
| revenue-by-year-monthly.json.tcl | Datasource for revenues-by-year-monthly Sencha line chart. |
| top-customers.json.tcl | Datasource for top-customers Sencha pie chart. |
Contact Us
Project Open Business Solutions S.L.
Calle Aprestadora 19, 12o-2a
08902 Hospitalet de Llobregat (Barcelona)
Spain
Tel Europe: +34 609 953 751
Tel US: +1 415 200 2465
Mail: info@project-open.com